
Using GIS and Models as Decision Making Tools
What is GIS (Geographic Information System)?
Watch this video to get a quick background on GIS and how it is used as a planning and decision-making tool.
Click the picture below to learn more!
Scenario
NOAA has identified the Choptank Watershed as a Habitat Focus Area in 2014. Assume that you work for NOAA and your goal is to analyze the land use and water quality data for Greensboro, a subwatershed within the Choptank Watershed and design an implementation plan to improve the water quality.
Follow the steps below to design and develop your implementation plan.
Step 1 (Engage): Graphing Land Use
Use the Greensboro 2011 Land Use map to calculate and create a graph to show the percentage of each land use category.
Click on each land use category, record the "Area in Hectares" and calculate the percentage for each land use type.
 Click on the map to interact with the Greensboro 2011 Land Use map
Step 2 (Explore): Claim, Evidence and Reasoning
Analyze the following table and graphs to study the relationship between population, land use, fertilizer use and water quality.

Table 1: Comparing demographic data between Town of Greensboro and Maryland.

Graph 1: Comparison of fertilizer use between Choptank Basin and Patuxent Basin

Graph 2: Water quality data from USGS gauging station at Greensboro Md.
Step 3 (Explain): Ways to improve water quality
Click the button to learn about Best Management Practices (BMPs).
BMPs are defined by EPA as "techniques, measures or structural controls used to manage the quantity and improve the quality of runoff". 
Step 4 (Elaborate): Using GIS and Models
Watch the video to get a quick background of how Dr. Fisher developed the Greensboro Watershed BMP Spreadsheet Model.
- Download the Excel file.
- In groups, use the Greensboro Watershed BMP Model to identify, calculate the cost and area of different BMPs that can be implemented to reduce nutrient (inorganic forms of nitrogen and phosphorus that all organisms need) loads in the Greensboro Watershed by 25%.
- Print your completed model.
- Click on the 2009 Greensboro BMP map.
- Using the map as base, identify suitable locations to implement BMPs in Greensboro.
- Use the Measure tool to identify locations and draw polygons to calculate the area in hectares.
(Hint: Use the icons in the toolbar to interact with the map) - For each location identified, discuss potential issues in implementing the BMP and propose possible solutions
![]()
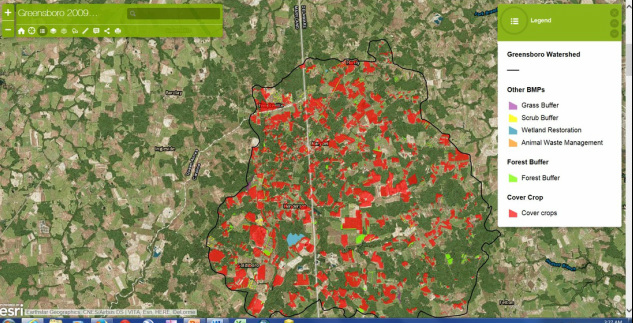
Click on the map to identify locations for your BMP plan
Step 5 (Evaluate): Creating and Communicating
Compile the data gathered from the previous steps and communicate your implementation plan for the Greensboro watershed by creating a report.
In your report, discuss some of the problems encountered in solving water quality issues.