
Making Connections
Field work and research should be essential components in every science class. GIS provides students the opportunity to make connections between student research/field work and historical and current scientific data. These connections are invaluable to the students' understanding of how the work they are doing in class relates to the world around them. GIS also provides students with exposure to STEM skills that will prepare them for College and Career.
Scenario: Students select one of two local subwatersheds to study, and make a hypothesis for water quality parameters based on observed land use and best management practices. Students will access ArcGIS online maps of the study site, and determine the types of land use for their watershed. To test their hypothesis, students will study the water quality of their site by conducting an experiment. Students will compile the data and discuss results of their experiment. Finally, students will compare their results with published scientific data from UMCES Horn Point (Dr. Fisher’s lab group).
Step One (Engage): Identifying Land Use Changes
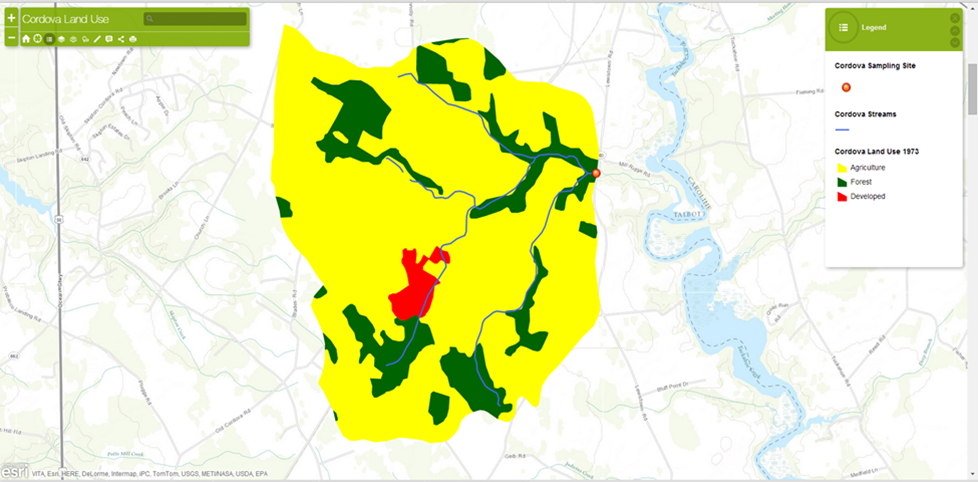
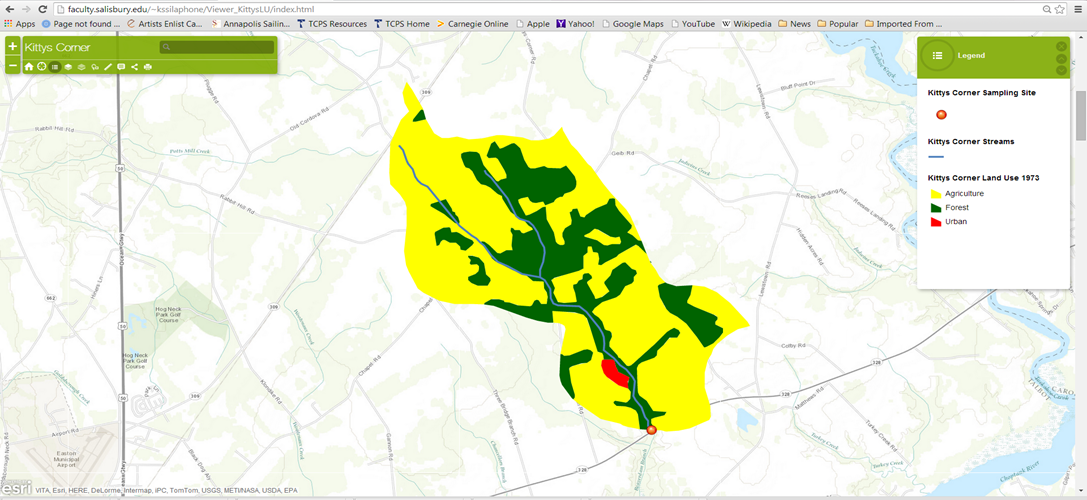
Use the Cordova or Kittys Corner Land Use Change maps to determine the percentages of agriculture, forested and developed areas in each watershed for the years 1973, 2002 and 2010.
In each map, click on the layers button on each map, click on each land use category, record the "Area in Hectares" and calculate the percentage for each year.
Cordova Land Use Change Map
Click on the map to interact with the Cordova land use
Kittys Corner Land Use Change Map
Click on the map to interact with the Kittys Corner land use
Use the Cordova or Kittys Corner Crop Type and BMP maps to determine which crop types and best management practices (BMPS) were in place within your watershed in 2010. Record you observations.
Cordova Crop Type and BMP Map
Click on the map to interact with the Cordova crop type and BMP maps
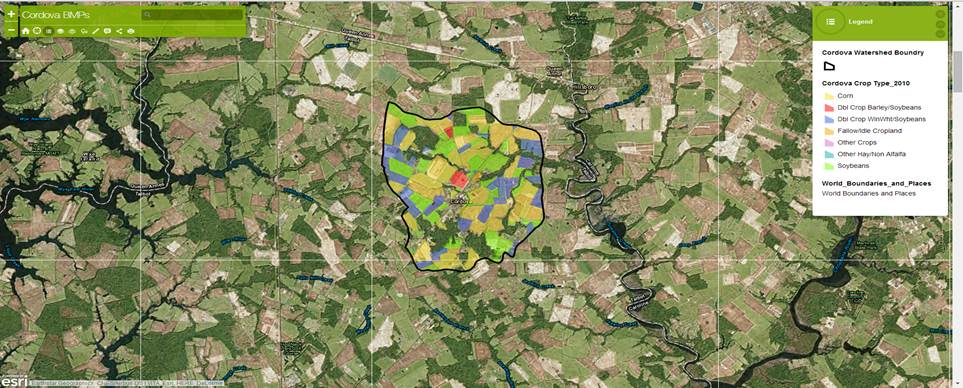
*Dbl crop: double crop*
*WinWht: Winter Wheat*
Kittys Corner Crop Type and BMP Map
Click on the map to interact with the Kittys Corner crop type and BMP maps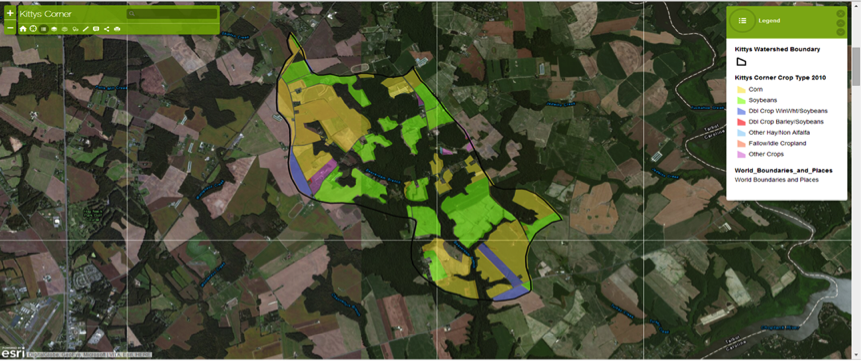
*Dbl crop: double crop*
*WinWht: Winter Wheat*
Step Three (Explain): Field Work
As part of a field trip the students will visit the sampling sites of both the Cordova and Kittys Corner subwatersheds. The students will complete a site assessment and collect water samples to bring back to the classroom for analysis. The students will use LaMotte water quality kits to test for the following parameters:
· Dissolved oxygen
· pH
· Phosphates (PO4)
· Nitrates (NO3)
· Ammonia (NH4)
Step Four (Elaborate):
Using the tables below, students will use excel to graph water quality monitoring data collected by scientists at UMCES Horn Point (Dr. Fisher’s lab group). The data consists of yearly averages for nitrates, phosphates, ammonia and pH. After completing the graphs students will identify any trends in the data.
Finally students will add their data points to the graphs to analyze the relationship between their data and water quality data collected by the UMCES Horn Point scientists.
Table 1: The following data shows the relationship between land use and water quality in the Cordova subwatershed monitored by UMCES Horn Point Laboratory (Dr. Fisher's lab group) between 2003 and 2013.
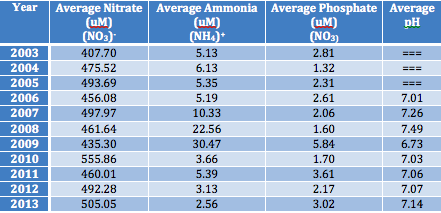
Table 2: The following data shows the relationship between land use and water quality in the Kittys Corner subwatershed monitored by UMCES Horn Point Laboratory (Dr. Fisher's lab group) between 2003 and 2013.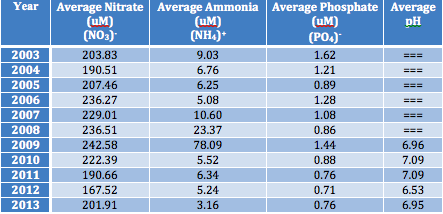
Step Five (Evaluate):
Students will compile their observations and data to write a conclusion, making sure that they support their claims with evidence and scientific reasoning. Students should explain the importance of their study to the water quality and overall health of the Chesapeake Bay and how the water quality in their watershed impacts the bay.
Extension
In order to motivate students to pursue careers in STEM and to make them College and Career Ready, it is important for students to experience the processes involved in conducting scientific research. With that in mind, students can work in small groups and carry out research that is related to the Chesapeake Bay, on topics of their choice. These research projects will be semester long and encompass the following components:
Selecting a broad topic of interest
Conducting background research
Developing a research question and making a hypothesis based on background research
Writing a proposal as to why their research is important to the Chesapeake Bay
Designing and implementing experimental procedures to collect data
Data analysis
Drawing conclusions based upon data and observations
Communicating their results in a mock environmental symposium