Wacky Watersheds
Overview
This activity is designed to introduce students to the concept of a watershed. The hands-on portion of the activity allows students to build a watershed of their own design. After the model has been built, students will analyze how water moves over the land and collects into a common area.
Instruction Time
1-2 45 minute class periods.
Objectives
- Students will become familiar with the terms, runoff, watershed, and land use.
- Students will understand how topography influences the overland flow of water.
- Students will understand how runoff accumulates various materials (including pollutants) and collects into a larger body of water.
Materials
- Xerox box lid (or a cardboard box of similar dimensions)
- newspaper, cardboard, smaller boxes—any materials suitable for creating the contour of the “land”
- scissors
- Crayola washable markers
- small, white trash bag
- medium binder clips
- spray bottle filled with water
- tape or glue (optional-may be used to cut up materials for the landscape)


Procedure
- Students will work in small groups, preferably 2 to 3 students per group. Each group will need the materials listed in order to build their watershed model.
- The box will serve as the base of the watershed. As a group, students will decide which materials they will use to shape the “land” inside their watershed. Students should include both high and low points in their model.
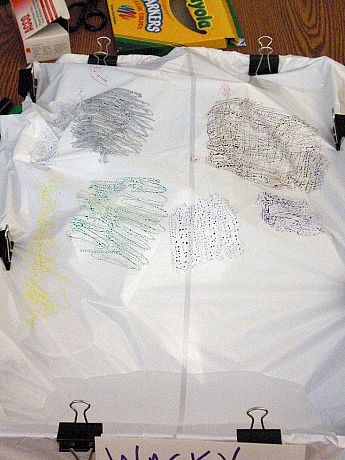
- Once the bottom layer of the model has been assembled, place the trash bag over the model so that it covers the contours of the model’s landscape. Use the binder clips to secure the edges of the bag to the box lid.
- After the trash bag is secure, students will use the markers to color various areas of the trash bag. The different colors will represent different types of land use in their watershed. Blue: forested areas; Brown: farms/agriculture; Red: mined areas; Black: residential areas; Green: wastewater treatment plant; Yellow: industrial areas/factories; Purple: development/construction. Students may choose as many land uses as they wish or the teacher may choose for the groups.
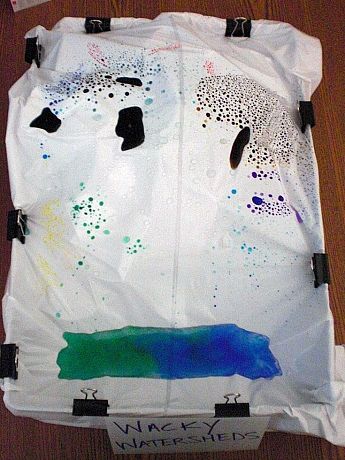
- Once the colors have been applied to the trash bag, the teacher should check the setup of the watershed. Teacher should add some clear water to a low area of the watershed before students will apply the “rainstorm”.
- Students will use the spray bottle to simulate rainfall across their watershed and watch how the water flows.
Discussion
1. Where did the water pool on your model? Why did it stay in these areas?
2. What types of land use did you choose for your watershed?
3. What color is the water in the pool(s) at the end of the experiment? What does this color represent to you?
4. How would you describe a watershed?
5. What happens in a watershed when it rains?
Extension Activities:
Teacher can instruct or ask the students to come up with their own suggestions.
1. How could you incorporate groundwater into this model?
*Use sponges, straws, other tubing, holes in the plastic
2. What could you use to represent buffers in the watershed?
*Use sponges, grass, biodegradable packing peanuts, or other absorbent material
Lesson Resources
National Science Education Standards
K-12 Unifying Concepts and Processes
-Systems, order, and organization
9-12 A Science as Inquiry
9-12 B Physical Science
-Motions and forces
9-12 C Life Science
-Interdependence of organisms
-Matter, energy, and organization in living systems
9-12 D Earth and Space Science
-Geochemical cycles
-Origin and evolution of the earth system
9-12 F Science in Personal and Social Perspectives
-Natural Resources
-Environmental quality
The Nitrogen Cycle
Overview
Students will work together to create the compounds found within the nitrogen cycle and string the pieces together to form the pathways of the cycle.
Instruction Time
1-2 45 minute class periods.
Objectives
- Students will become familiar with the pathways through which nitrogen cycles in the environment.
- Students will be able to reconstruct the progression of transformations that take place in the nitrogen cycle.
Materials
- Large index cards, 5 x 8”, white
- Sharpie marker or pre-made N Cycle Cards
- Scissors
- String (different colors may be needed)
Procedure
1. This activity can be done either inside or outside the classroom, but will require some space for students to spread out as they form their nitrogen cycle. Students should have read over the background information about the nitrogen cycle found on the “From Land to Sea” Explore page.
2. The index cards will represent the compounds found within the nitrogen cycle. A card will be needed for each of the following:
- Organic N (nitrogen)
- NH4 (ammonium)
- N2O (nitrous oxide)
- NO2 (nitrite)
- NO3 (nitrate)
- N2 (nitrogen gas)
Write the name/symbol on the front of the card and the name of the compound on the back. If possible, laminate the index cards. Then use a hole puncher to punch a hold on the sides of each card. This is where the string will be attached. Cut the index cards in half with the scissors so that each card has a unique pattern, like a puzzle piece.
Alternatively, print out the N Cycle Cards, fold each card in half and glue or tape each half together, or cut each card in half and glue each side to a 5x8" index card. If possible, laminate the cards once folded and glued. Next, use scissors to cut each card on the indicated dashed line to create "puzzle pieces." Punch holes as indicated on the cards.
3. Each student will receive half of an index card and will have to find their match in order to form a compound.
4. Once all of the compounds have been formed, students will have to arrange themselves in the proper nitrogen cycle pathway. They will link themselves together using the string provided. Students should tie one end of their piece of string to their compound and tie the other end to the next compound in the nitrogen cycle. The final result should follow the pathways shown in the Nitrogen Cycle diagram on the “Explore” page.
5. If there are more than 12 students, two sets of cards and string could be used. Student groups could compete against each other to see which group can form the nitrogen cycle first. In this case, a different color of string would be used for each group.
Discussion
1. Nitrogen is a nutrient that makes plants grow. How can a nutrient become harmful?
2. What is the role of bacteria in the nitrogen cycle? Where are these bacteria found?
3. What is nitrification?
4. What is denitrification?
5. Where does the excess nitrogen come from?
6. How can we prevent excess nitrogen from entering our streams?
Lesson Resources
National Science Education Standards
9-12 B Physical Science
-Motions and forces
-Interactions of energy and matter
-Interdependence of organisms
-Matter, energy, and organization in living systems
9-12 D Earth and Space Science
-Geochemical cycles
Profiling a Watershed
Overview
This activity illustrates how nutrient levels in a body of water vary based on the type of land use taking place in the watershed. Students will become familiar with reading a geographic information system (GIS) map image and will be able to describe how different types of land use affects the water.
Instruction Time
2 to 3 45-minute class periods.
Objectives
- Students will analyze data to determine the relationships between land uses and nutrient concentration.
- Students will interpret geographic information system (GIS) images to calculate the percentages of land use in a watershed.
- Students will create a nutrient profile for each watershed based on their interpretation of the land use.
Materials
- Watershed Maps, Land Use Documents, and Nutrient Profile Chart (download PDF's below under Lesson Resources)
- Calculator
Procedure
Part I: Land Use Analysis
- Have students read the four land use documents, which include agriculture, urban, forest and feedlot. For each type of land use, students should examine the corresponding graphs reporting hypothetical nitrogen and phosphorus concentration.
- Have students interpret the graphs to determine how nutrient concentrations typically change depending on the proportion of each land use in the watershed. Have students will fill in the trend for each type of land use (for example, as agriculture increases, nitrogen and phosphorus will also increase).
- Once students have completed the four types of land use, they should check in with the instructor before moving onto Part II.
Part II: Watershed Analysis
- Students will view maps generated with GIS software of four different hypothetical watersheds. Each map shows the land area (km2) for each type of land use.
- Using this data, students will calculate the percentage of land use and create a pie chart to display the information for each watershed.
- Based on their knowledge of land use and how it affects nutrient concentration (from Part I), students will complete the Nutrient Profile Worksheet. In this nutrient profile, they should determine estimated nutrient levels by referring to Part I. In the columns labeled N and P, students should choose either high, medium or low to represent the relative amount of nutrients coming from each watershed. Students will also fill in the percentages of land use for each watershed.
Discussion
- What are some sources of excess nitrogen and phosphorus? What types of products contain these nutrients?
- Why is nitrogen an essential nutrient for plants and animals?
- Why is phosphorus an essential nutrient for plants and animals?
- What is eutrophication? What are some of its effects? (see the Dead Zones or Aquatic Food Webs modules for more information)
- Identify three ways to help decrease the amount of nutrients entering our waterways.
Extension Activity
Materials
- Aerial photographs of your local area showing land use (USGS is a good place to track these down)
- Four different colored markers or highlighters
- Calculator
Procedure
- Supply students with an aerial photo of where they live or a portion of the watershed where their school is located.
- Have them outline the different land uses in colored markers or highlighters.
- Aerial photos should have a scale bar. Have students use a ruler to measure the area of the different land uses. This can be done by dividing the sections of land into squares and/or triangles.
- Once the areas have been determined, students can then calculate the land use percentage in their watershed.
Lesson Resources
![]() Watershed Maps
Watershed Maps![]() Land Use Documents
Land Use Documents![]() Nutrient Profile Chart
Nutrient Profile Chart
Calculator
National Science Education Standards
K-12 Unifying Concepts and Processes
-Evidence, models, and explanation
9-12 A Science as Inquiry
-Abilities necessary to do scientific inquiry
-Understandings about scientific inquiry
9-12 F Science in Personal and Social Perspectives
-Natural Resources
-Environmental quality


