
For the teacher:
Overview: Normalized Difference Vegetation Index (NDVI) is a commonly used vegetation index that is used in the analysis and decision making processes regarding health of vegetation. Students will learn how the index is derived and how the values help interpret land cover data from Landsat satellite images.
The purpose is to teach the foundations of NDVI so that it can be used in analysis and decision making.
Students should have prior knowledge about the electromagnetic spectrum and about data available from Landsat satellite images. They should also understand basic principles and capabilities of GIS.
Key Vocabulary: Water Year, Land Cover, Watershed, Near Infrared, Vegetation Index
Instruction Time:
One to two 45 minute periods
Objectives:
Students will be able to interpret NDVI values and understand their relationship to land cover.
Students will be able to make observations and discuss land cover changes occurring during a water year.
Students will be able to make a claim about a map and support that claim with evidence from the reading, the movies, charts, graphs and their observations.
Materials:
Computers with internet access, student answer sheet.
Activities:
1. Read the article on NDVI and answer the corresponding questions on the student answer sheet.
2. Watch the short film on NDVI and answer the corresponding questions on the student answer sheet.
3. Watch the movie on land cover changes for water year 1988 and make observations about changes in each type of land cover. Fill out corresponding table on the student answer sheet.
4. Write a hypothesis about land cover and how it might be influenced by precipitation.
5. Write a hypothesis about land cover and how it might influence water flow in the watershed.
6. Students share out to the class each hypothesis made in activity 4 and 5
7. Students make a claim about one of the dates of water year 1988 and support the claim with evidence from the reading, the movies, the charts and graphs and their own observations.
For the Student:
Answer the following questions:
1. Certain plant pigments absorb wavelengths of ____________________________
2. What is a vegetation index?
3. What are the range of values for NDVI?
4. What NDVI values correspond to dense healthy vegetation?
5. What can you find if you average NDVI values for an area over time?
6. What do you think a graph of NDVI values for a particular land cover, over a certain time period would show?
Watch this short video:
Answer the following questions:
1. Healthy vegetation absorbs light of __________ wavelengths and reflects light of __________ wavelengths?
2. If the NIR value is large and the Red value is small the NDVI will be ___________ and represent _____________.
3. If the NIR value is small and the RED value is large the NDVI will be ___________ and may represent ______________
4. If the NIR value and RED value are both large the NDVI will be ________________ and represent _____________.
5. What is the NDVI if the NIR value = the RED value?
6. Why do you think NDVI is a common used vegetation index?
Land Cover Changes during 1989 water year: Movie
Click on the picture below to watch the Land Cover change movie

Click here to download the land cover file.
Land Cover Type | Observations |
Forest | |
Other | |
Bare |
|
High Plant growth |
|
Low to Moderate Plant Growth |
|
Mean NDVI values for forest land cover during 1989 water year.png)
Questions for Graph:
1. What probably accounts for the plateau of mean NDVI values from 11/16 to 3/16?
2. Predict when leaves began to appear in 1988. Explain your answer.
3. Predict when leaves would begin to fall in 1988. Explain your answer.
4. Explain the plateau of mean NDVI values from 7/16/88 to 9/16/88.
Comparison of Land Cover to NDVI Values:
Now you will compare two maps. One showing five land cover types in the Greensborro Watershed and the other showing features with HIgh, Modearate and Low NDVI values.
Remember NDVI values range from -1 to 1. On the map the High NDVI values are ≥ 0.62, the Moderate values are ≥ 0.36 ≤ 0.62, and the Low values are ≤ 0.36.
Use the table below as a quide to studying the two maps. Look at each land cover type and try to determine what the NDVI values are for the type.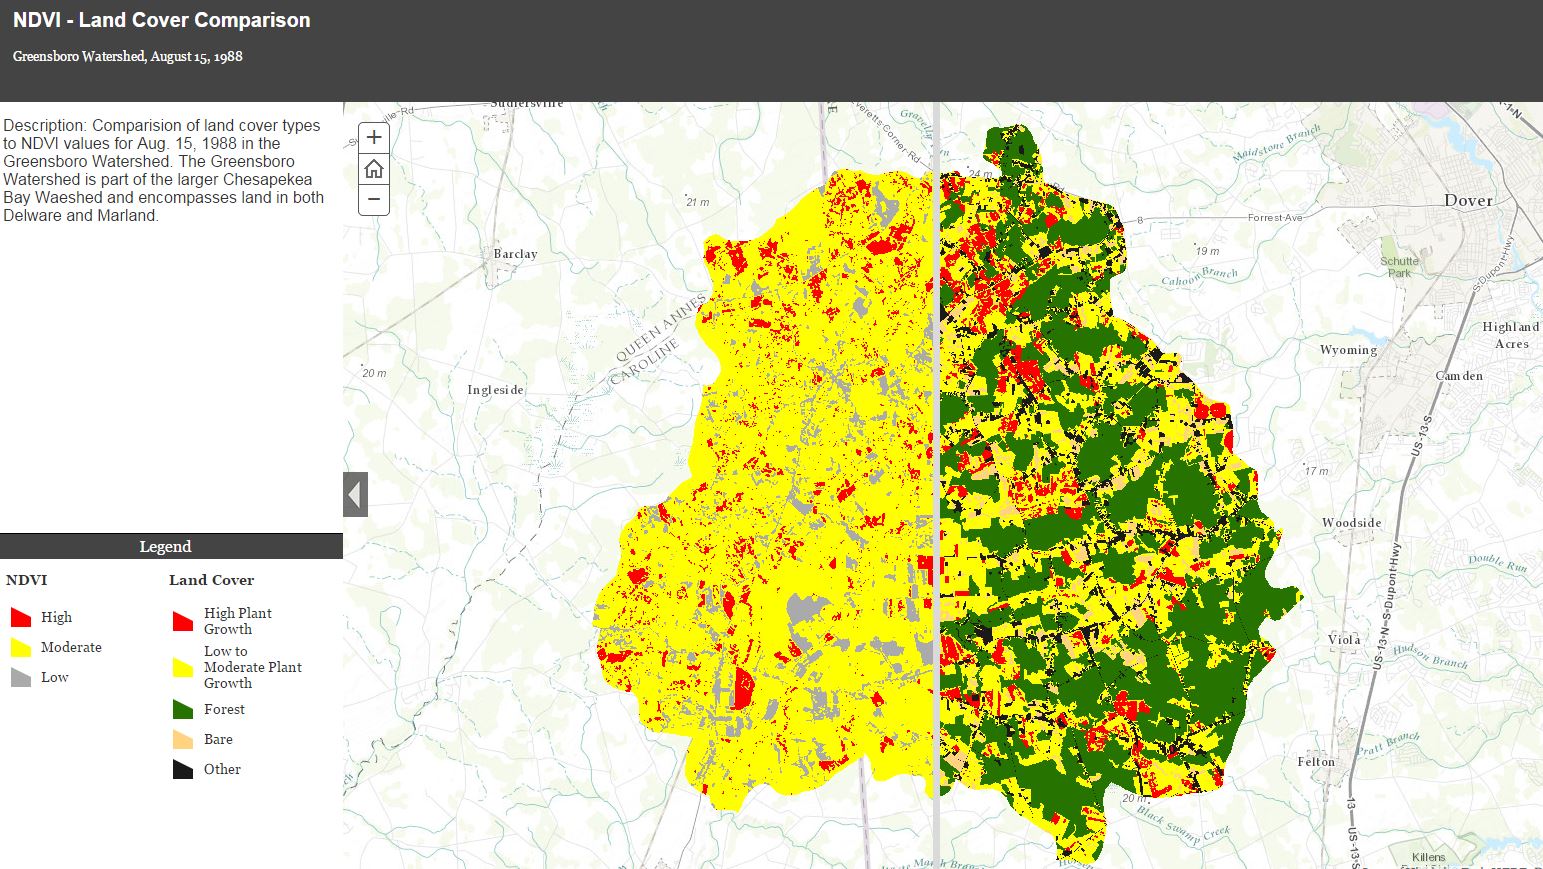
Fill out the table below: Write Yes or No in the table for NDVI values for each land cover.
Land Cover Type | High NDVI | Moderate NDVI | Low NDVI |
High Plant Growth |
|
|
|
Low to Moderate Plant Growth |
|
|
|
Forest |
|
|
|
Bare |
|
|
|
Other |
|
|
|
Questions for NDVI and Land Cover comparison:
1. Why do you think forest has more than one NDVI value?
2. Name another land cover type represented by more than one NDVI value.
3. Name a land cover type represented by one NDVI value.
4. Why do some land cover types have multiple NDVI values and some land cover types have only one NDVI value?
Wrap Up:
1. Write a hypothesis regarding land cover and precipitation during a water year.
2. Write a hypothesis regarding land cover and runoff in a watershed.
3. Referring to the land cover change movie, make a claim about one date in the 1989 water year and provide evidence to support it.