Using Landsat Data to Monitor Cover Crop Implementation
Agriculture and Chesapeake Bay’s Eastern Shore
The Eastern Shore of the Chesapeake Bay is also referred to as the Delmarva Peninsula for the three states that are part of it. Agriculture is a major part of Delmarva’s economy. Agriculture is essential to all people: farms provide us with food, natural areas, and aesthetic and economical benefits. Agriculture on Chesapeake Bay’s Eastern shore also has economic benefits. In Maryland; approximately 350,000 people are employed in agriculture related areas, making it the largest commercial industry in Maryland. In 2012, the total income from farms was approximately $2.3 billion. Kent and Sussex counties in Delaware are home to 86% of the state’s farms and Sussex county alone accounts for close to 80% of Delaware’s agricultural value. Virginia has only 2 counties on the Peninsula but those two counties have the largest average farm size .Together Virginia’s 2 Peninsula counties account for 13% of the state’s value of crops, and more than 45% of those two counties’ market value of agricultural products sold comes from crops.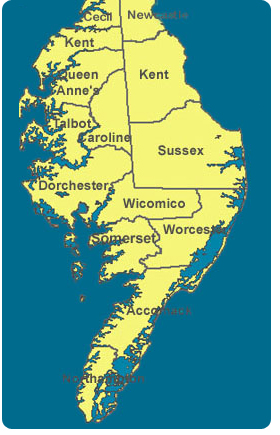
Agricultural impacts on the Chesapeake Bay
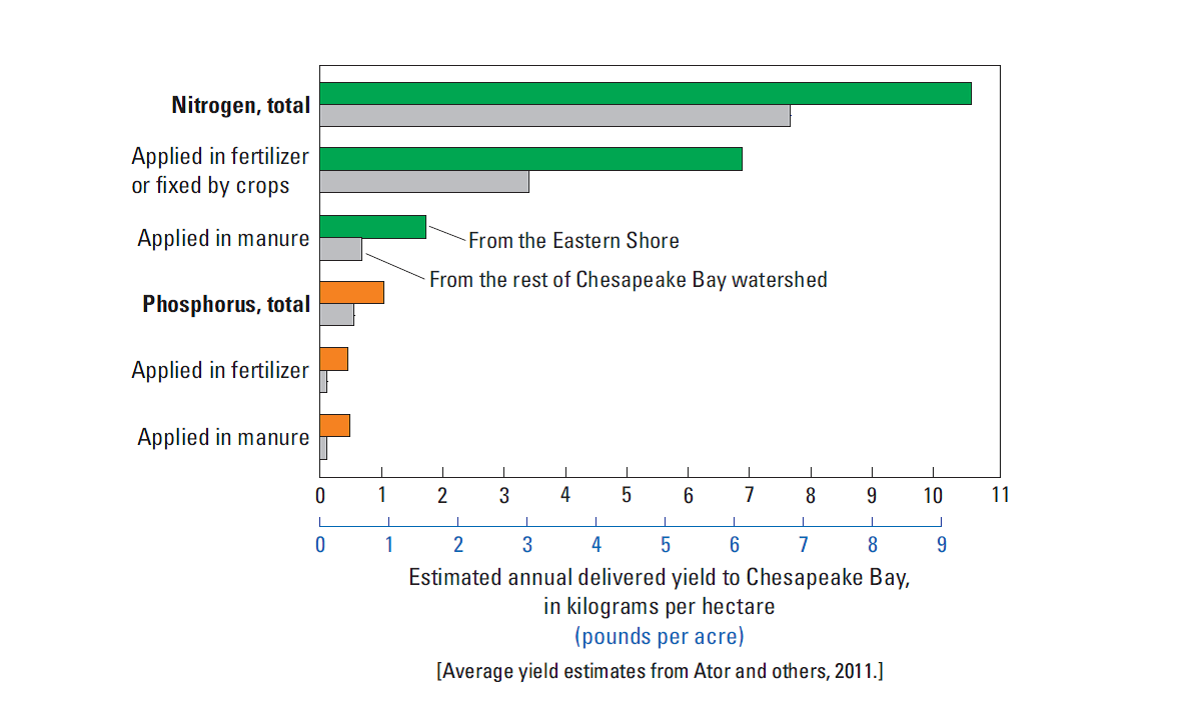
Agriculture is also the single largest source of nutrient and sediment pollution entering the Bay. While conventional tillage, fertilizers and pesticides can be beneficial to crops, their excessive use can pollute rivers and streams, pushing nutrients and sediment into waterways. A recent USGS report from the U.S. Geological Survey (USGS) concluded that nutrients flowing from the Chesapeake Bay’s Eastern Shore make up a disproportionate amount of the excess nitrogen and phosphorus polluting the estuary. But per square mile, Delmarva receives nearly twice as much nitrogen and phosphorus as other areas in the region, leading to degraded water quality in the rivers, streams and groundwater that flow to the Bay. These nutrients can fuel the growth of harmful algae blooms that block sunlight and create low-oxygen areas, or “dead zones,” that suffocate marine life. According to the report, agricultural production—including fertilizer and manure applied to cropland—accounts for more than 90 percent of the nutrients reaching the lands of the Eastern Shore. When more fertilizer and manure is applied to the land than is needed by crops, nitrogen builds up in the groundwater and phosphorus builds up in the soil, and these nutrients eventually move into streams that flow to the Chesapeake Bay.
Estimated average annual yields of nitrogen and phosphorus to Chesapeake Bay from the Eastern Shore and the remainder of the Chesapeake Bay watershed
Cover crops as a way to reduce nitrogen and phosphorus from agriculture
Managing agriculture and other human activities to limit the movement of nitrogen involves limiting nitrogen applications, modifications to increase the effectiveness of natural nitrogen removal such as riparian buffers, contour tillage, manure or fertilizer injection and wetland restoration. Nitrogen, however, moves from the land to streams on the primarily through groundwater in the form of nitrate especially after harvest. Winter cover crops can sequester excess soil nitrogen in vegetation and thereby limit losses to groundwater. As phosphorus compounds are relatively insoluble and typically remain bound to soil particles when applied in excess and move to streams after major rain event, cover crops, riparian buffers, contour tillage, conservation tillage, and other land-management practices designed to minimize soil erosion are often effective at limiting phosphorus transport.
Click on the NPR radio link below understand how cover crops work under different situations
https://www.npr.org/player/embed/382475870/383214986
Using Landsat data to monitor cover crops: A case study of Greensboro watershed on the Eastern Shore of the Chesapeake Bay
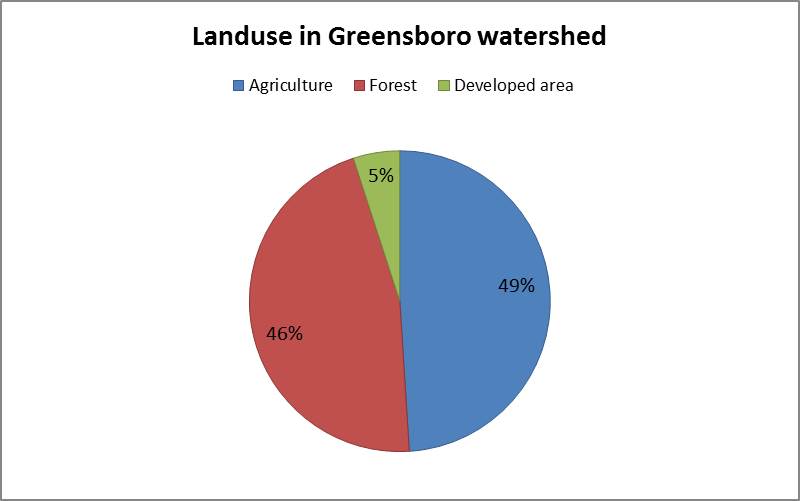
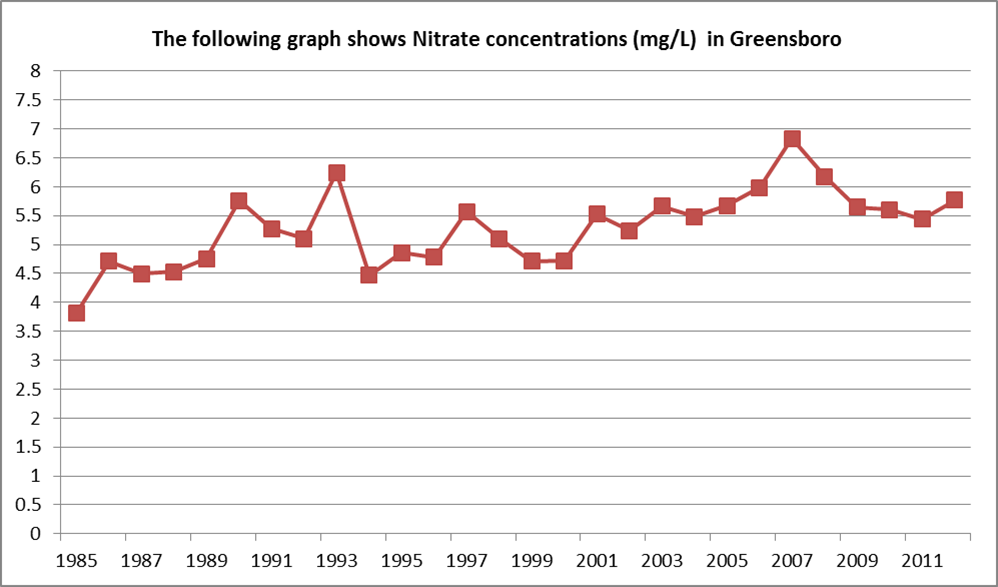
The Greensboro watershed is on the Eastern Shore of the Chesapeake Bay with 204 km2 of the watershed in Delaware and 91 km2 in Maryland. The following graphs show the land use in the Greensboro watershed and the Nitrate concentrations measured at the USGS gauged station in Greensboro.
Questions to think about…..
The nitrate concentration has_____________________________________
Is there a relationship between land use and water quality? ______________________________
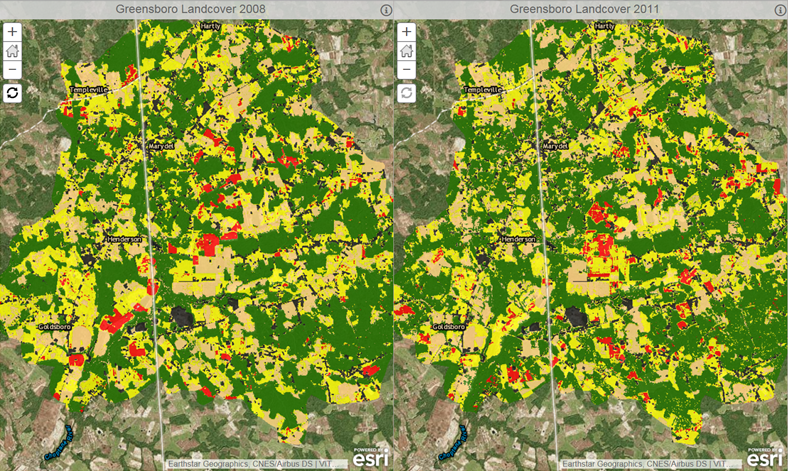
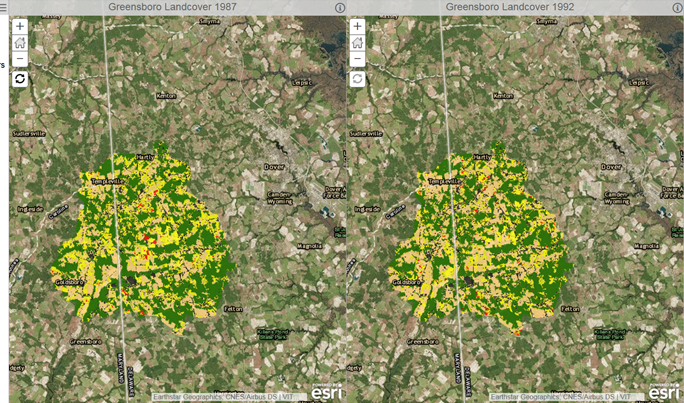
Click on the maps below to analyze the changes in cover crop between 1987 and 2011
Comparing 1987 and 1992
Comparing 2001 and 2002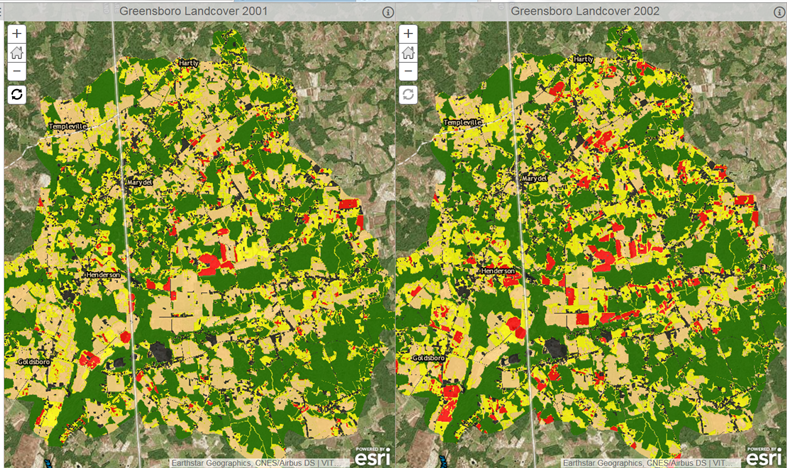
Comparing 2008 and 2011
Click on each map and record the cover crop area in hectares for each year graph the data to explore changes in cover crop between 1987 and 2011.
Review
1. Describe the changes in cover crop implementation between 1987 and 2011.
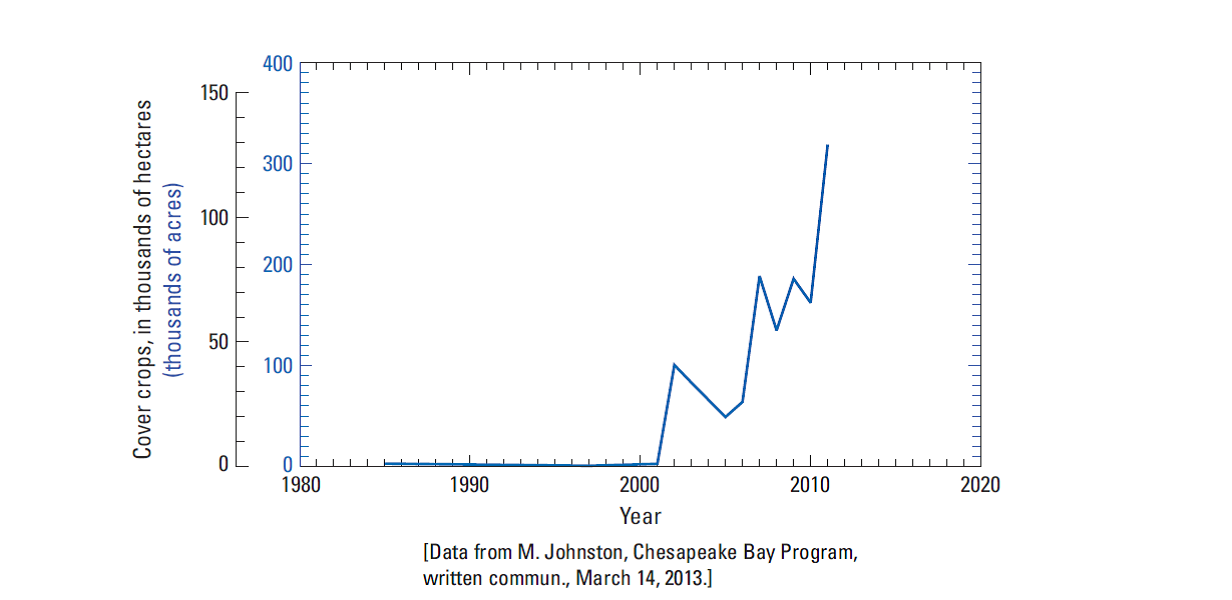
2. The following graph shows the implementation of cover crops on the Eastern Shore of the Chesapeake Bay. Compare the cover crop implementation in Greensboro to the cover crop implementation on the Eastern Shore of the Chesapeake Bay.
3. Based on the data that you analyzed do you think cover crops have helped reduce nitrate levels in the Greensboro watershed? Support your claim using the data that you analyzed.

