Teach: Land-Water Connections Lesson Plan
Overview: Land-Water Connections
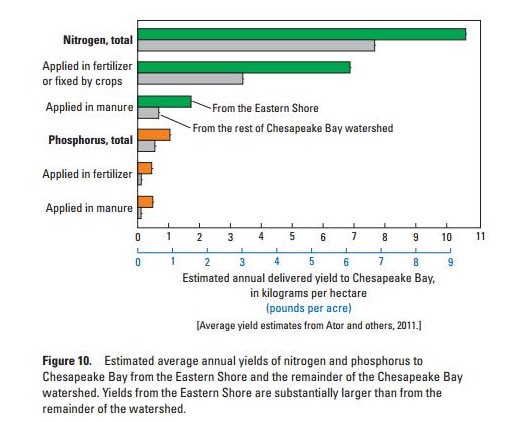
Despite the fact that most of the population of the Chesapeake Bay Watershed lives north or west of the Delmarva Peninsula, the Delmarva Peninsula has a higher yield per unit area of Nitrate and Phosphate (nutrient pollution) going into the Chesapeake Bay and its tributaries due to agriculture.

Source: https://pubs.usgs.gov/circ/1406/pdf/circ1406.pdf
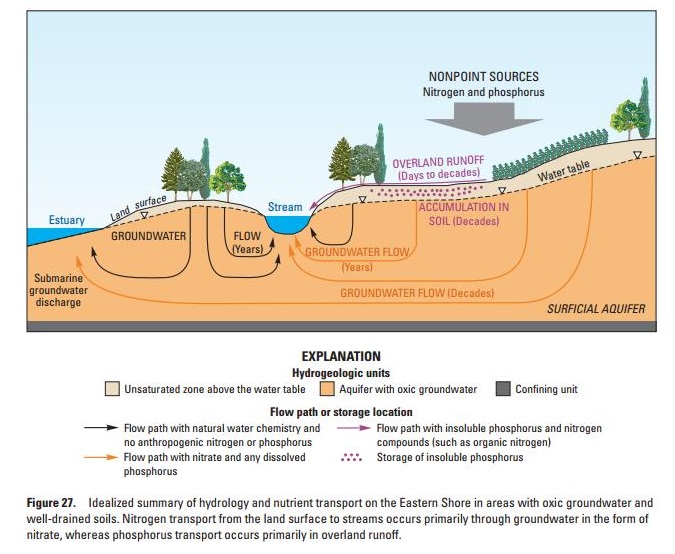
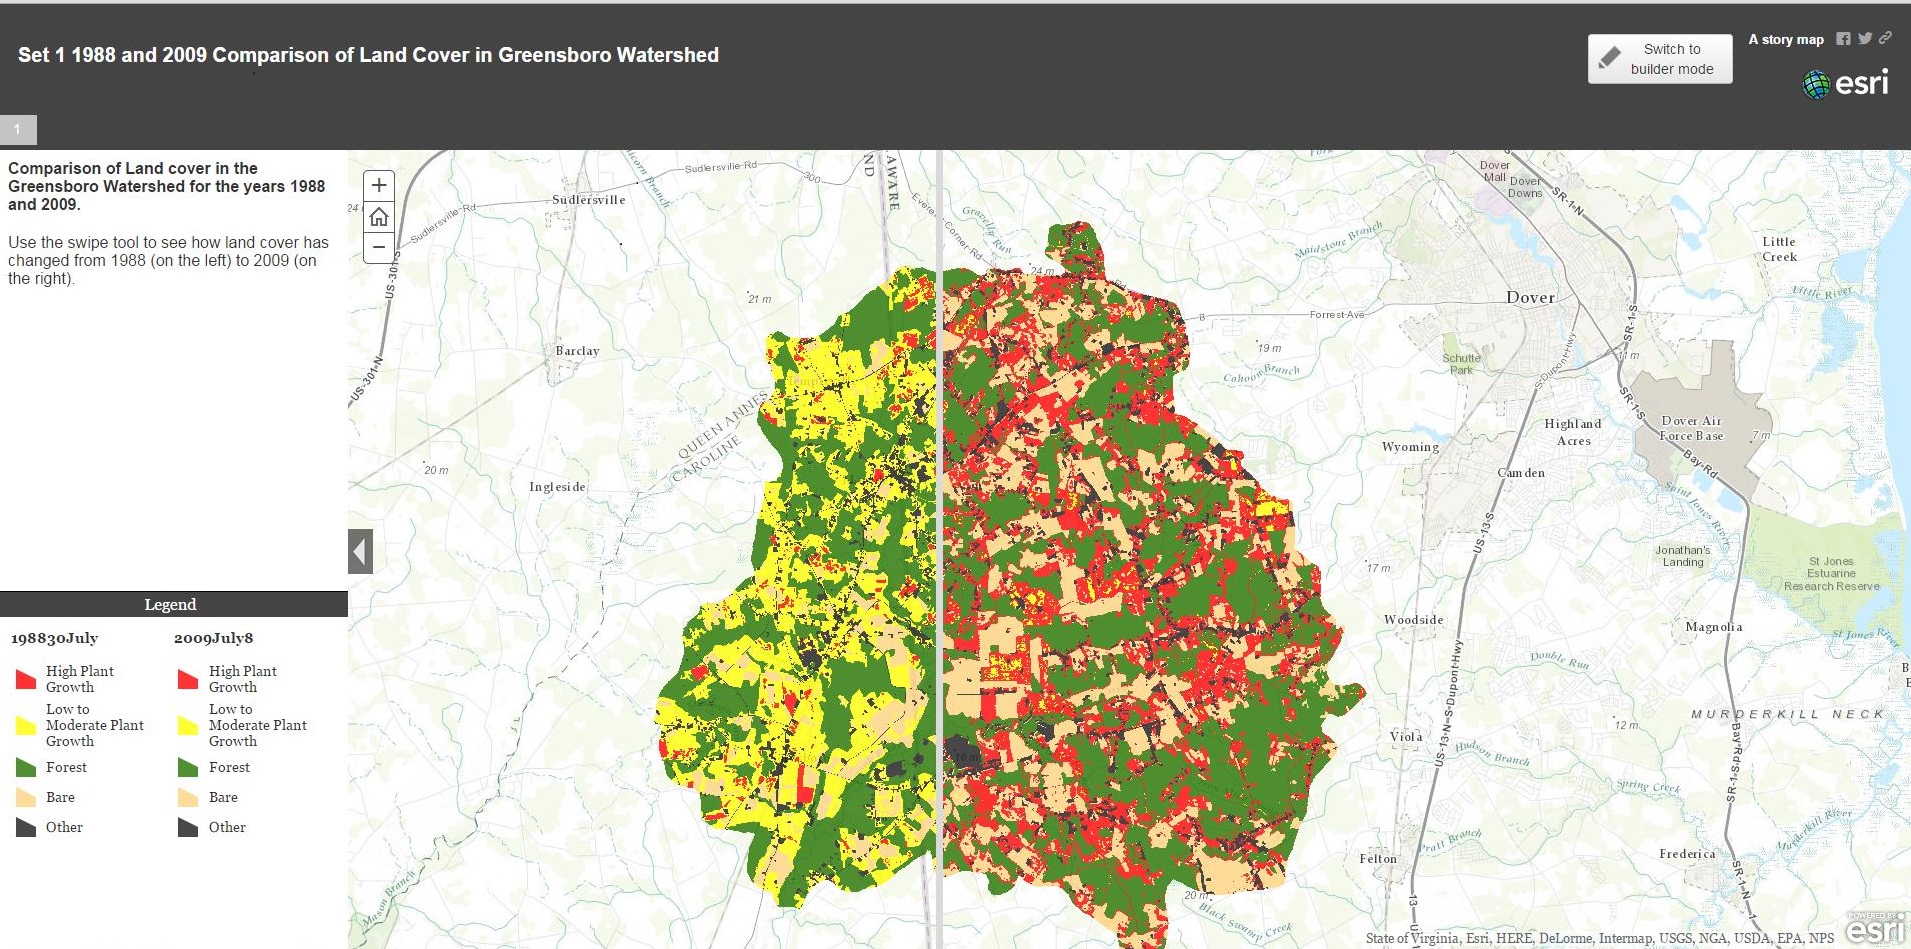
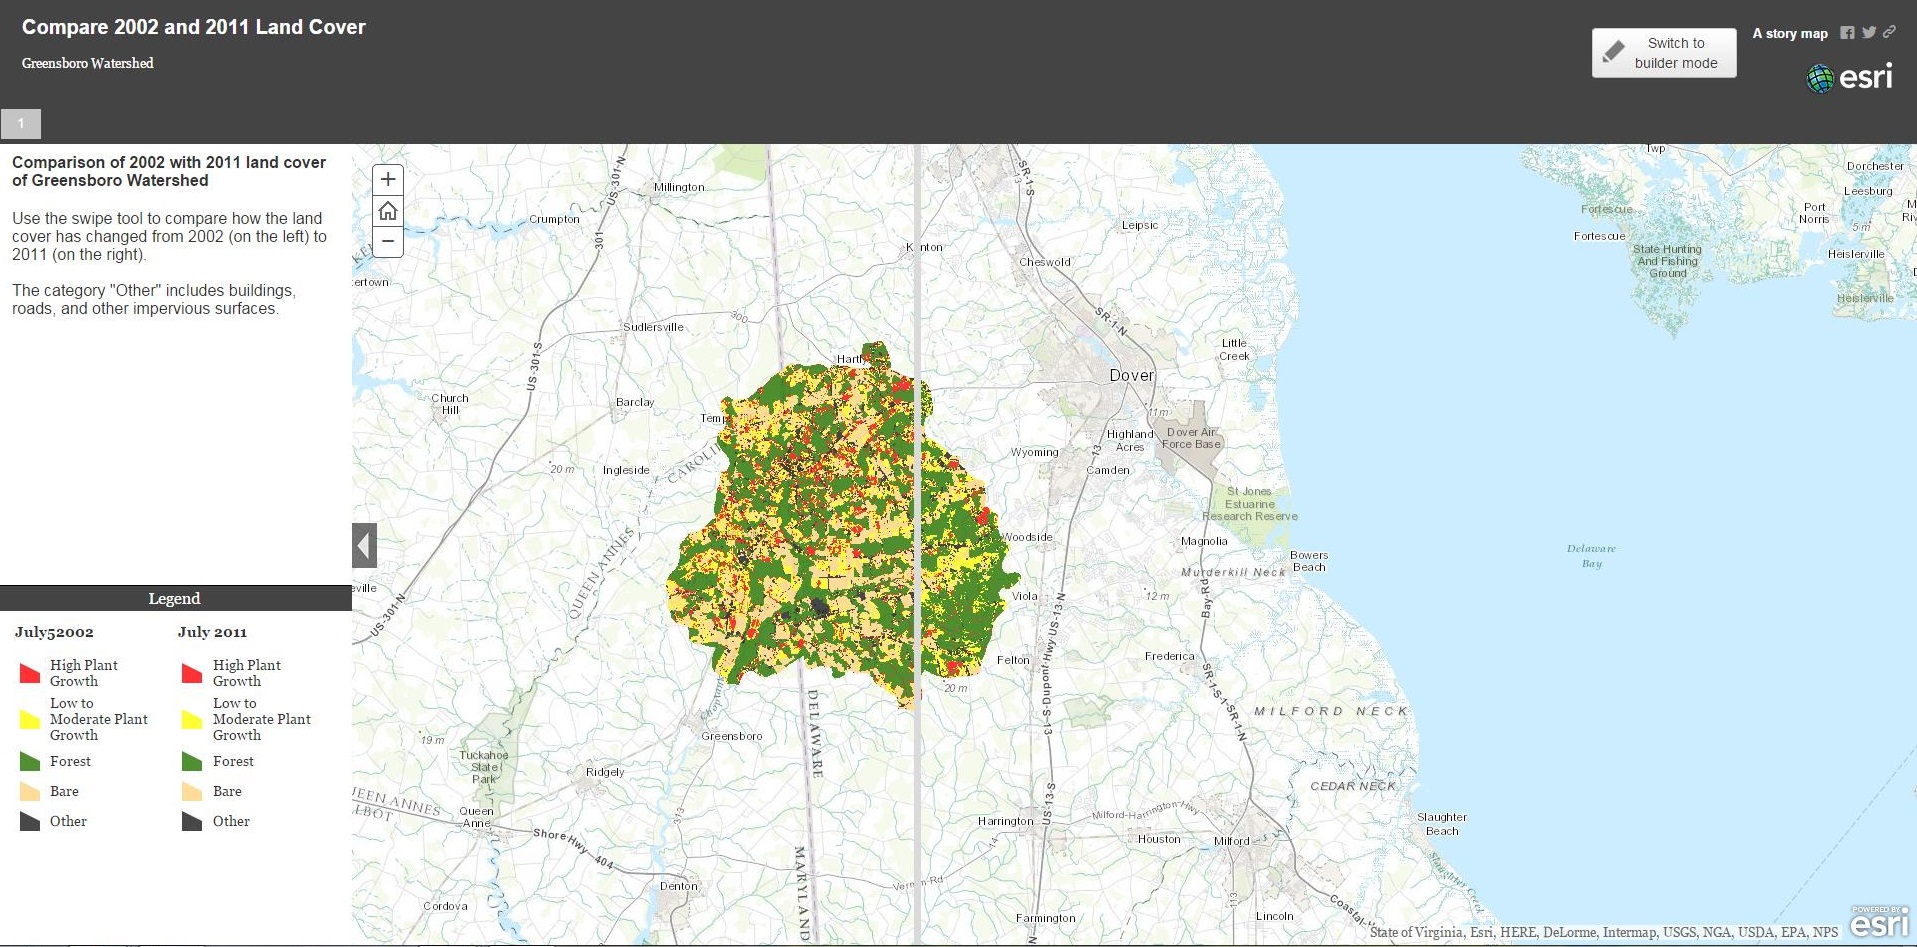
Although population on the Delmarva Peninsula has not changed too much as compared to the rest of the watershed, land cover has. The change in land cover could be due to farmers planting different types of crops or implementing cover crops for the winter to lack of growth of crops due to climatic conditions such as drought. The figure below shows how nitrate and phosphate are transported by ground water and surface water. Note that nitrate and phosphate enter the waterways through different paths.

Source: https://pubs.usgs.gov/circ/1406/pdf/circ1406.pdf
Because land cover and weather differ from year to year, scientists study water pollution of a watershed by looking at data during a water year. According to the USGS, a water year is “the surface-water supply defined as the 12-month period from October 1 through September 30, of the following year. Thus, the year ending September 30, 1999 is called the "1999" water year.” The water years used in this lesson are: 1988, 2002, 2009, 2011. The activity compares two sets of water years. Set 1 is 2009 and 2011; Set 2 is 1988 and 2002.
The purpose of this activity is to demonstrate to students how water quality can change overtime due to changes in landcover and seasonal variances in precipitation. Changes in land cover were derived from Landsat satellite data.
Students should have prior background in types of water pollution (specifically nutrient and sediment) due to runoff and ground water as well as an understanding of different types of land cover.
Instruction Time
1 to 2 45 minute periods
Objectives
- Students will be able to interpret data (climatographs, nitrate, phosphate,) and hypothesize the relationship among the given data
- Students will be able to discuss how land cover has changed over time in the Greensboro Watershed of the Chesapeake Bay
- Students will evaluate the relationships among all the given data with the change of land cover over time in the Greensboro Watershed to propose ways to reduce and mitigate sediment and nutrient pollution into the watershed.
Materials
Computer with internet access
Print out of each Set of Water Year Data (see below)
Procedure
1. Put students into a group of 3 or 4 and assign the each group a data set. (Set 1: 2009/2011, Set 2:1988/2002) and pass out a student data sheet, 1 per person. (Ideally, hand out the student data sheet electronically so they can access the ArcGIS from the embedded websites.)
2. Have students preview the student data sheet in order to become familiar with the flow of the lesson. Students should also fill out the first hypothesis on their data sheets at this time.
3. Step 1- students will use computers to access the web map and they will click on their assigned water year. The group of students will make observations of land cover change and write down changes they observe and answer the questions on the data sheet. (At this time, students can be given a set amount of time and work at their own pace between the steps as the student data sheet will help guide them)
Set 1: 2009/2011 Set 2: 1988 /2002
Link 1 Link 2
4. Step 2- students will interpret the climatographs for their set in order to determine the temperatures and precipitation for the year. They should also compare this to the normal precipitation and temperatures.
5. Step 3- students will interpret nitrate and phosphate pollution data from their water year set and answer questions. (You may want to distribute paper copies of the data)
6. Step 4- After the groups have completed their initial data collection, they will brainstorm to figure out what is causing the change in pollutants in their water year set on their data sheet.
7. Step 5- Split the groups (like a jigsaw)- Have 2 students from Set 1 work with 2 students from Set 2 to analyze their data. They should look at changes in land cover, changes in precipitation, and how nitrate and phosphate pollution have changed over time. They should brainstorm and answer the question: What has contributed to the increase of water pollutants in the water?
8. Step 6- Students should answer the final question- What do you think should be done in order to prevent or mitigate the presence of water pollutants in the Greensboro Watershed?
9.Step 7- discussion- Discuss with entire class their experience with this activity- any difficulties? Why? (Try to discuss why it’s “hard” to prevent water pollution, the many factors involved, many different types of stakeholders involved.)


