Physics behind Remote Sensing: Electromagnetic Radiation
Introduction to Electromagnetic Radiation
Electromagnetic waves are produced by movement of electrically charged particles. These waves are also called "electromagnetic radiation" because they radiate from the electrically charged particles. Electromagnetic radiation act like both waves and a stream of particles. They have the ability to travel through empty space as well as through air and other substances. All electromagnetic waves travel through space at the speed of light. An electromagnetic wave is characterized by a wavelength and a frequency. A wavelength is one cycle of a wave, and is measured as a distance between any two consecutive peaks of a wave (The peak is the highest point of the wave, and the trough is the lowest point of the wave). A frequency is the number of wavelengths that pass a certain point in a given length of time.
These two quantities are related to the speed of light by the equation.
speed of light = frequency x wavelength
Click on the image to interact with a model of the electromagnetic spectrum
(Source :https://targetedindividualscanada.files.wordpress.com/2011/06/spectrum.jpg)
Introduction to Spectral Remote Sensing
We can use remote sensing images from satellites or air crafts to identify different features without being there. To do this we need to know how different objects reflect and absorb light. The absorption characteristics are called spectral signatures and are recorded as Digital Numbers (DN). Spectral signatures are plots of the reflected radiation of different objects collected using different wavelength filters of the satellite sensor. Spectral signatures can be used to identify, distinguish and monitor various land cover features. The higher the DN value the higher the reflectance and therefore brighter the image. The lower the DN value the lower the reflectance therefore darker (black) the image.
Click the image below to watch a video and learn how satellites use the electromagnetic radiation and spectral signatures to collect land cover data
Exploring Landsat imagery to analyze spectral signatures
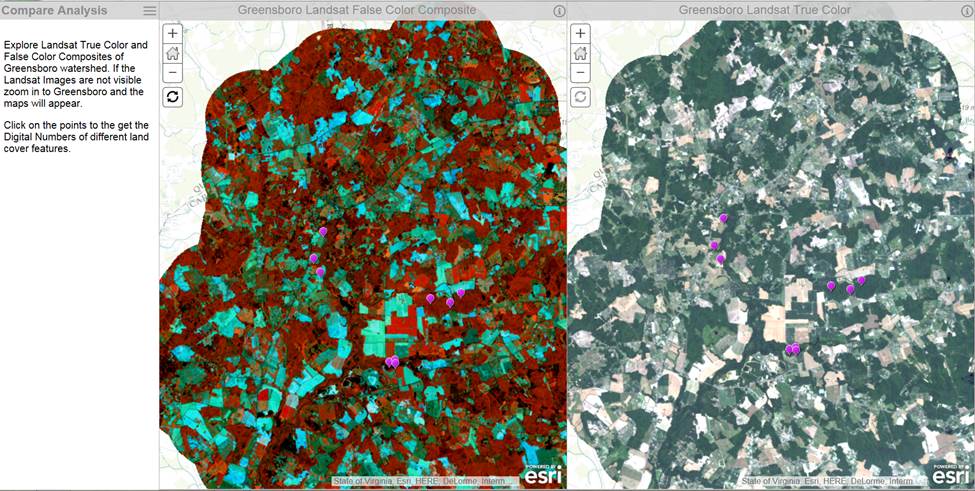
In this section you will explore Landsat images for Greensboro watershed located in the Delmarva Peninsula. There are two images. The “true color” image is how our eyes would normally see an image and was created using the Red, Blue and Green bands. The “false color” image is a representation of bands that are not visible to our eyes. This image was created using Near Infrared 1, Near Infrared 2 and Shortwave Infrared bands. The near infra-red band on this image is particularly useful to identify vegetation as vegetation reflects more energy in this part of the spectrum than the visible green part of the spectrum.
Click on the points in both the True Color and False Color images to get the Digital Numbers of different land cover features and record it in the chart below.

Graph the average of Digital Number and Bands for each land cover feature to explore their absorptive and reflective properties. This graph can be used to validate the claims made in the video and in the contents of this page.
Review
What do the digital numbers represent?
Explain the spectral signatures of vegetation, water and bare ground.
Why does the spectral signature of vegetation spike in the NearInfrared_1 band?
Based on the Landsat data that you analyzed and graphed write a paragraph evaluating the contents of this page and the video.


