Developed by Dr. Laura Murray, University of MD Center for Environmental Science, Horn Point Laboratory
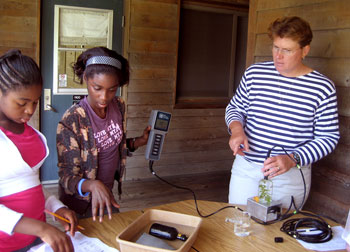
Students conduct a hands-on science experiment focusing on how different levels of light affect photosynthesis in seagrass.
Objectives
Students will understand the principles governing experimental design, including formulating a question, developing a hypothesis, and understanding controls and variables; students will understand the fundamental concepts associated with plant photosynthesis.
Materials
- Clear BOD bottles and stoppers (2 per group)
- Dark BOD bottles and stoppers (1 per group)
- Shade for 1 clear BOD bottle (1 per group) (shade is composed of 2-3 screens sewn into a pocket that a bottle can slide into and should block out ~50% sunlight)
- Kitty litter trays to hold each group’s bottles
- Water ( we use filtered river water but you can use fresh water if you’re using a fresh water seagrass species)
- Seagrass (we use Redhead grass, Potamageton perfoliatus but other species can be used and purchased from pet supply company)
- Oxygen probe (YSI or Vernier probe, which can be purchased for about $250)
- Magnetic stir plate and stir bars
- Large tub or pond to place treatments into water bath
Procedure
Students should follow the same instructions outlined below in the Student Worksheet, which you can download from the Lesson Resources section.
Part A: Determining the Initial oxygen concentration
- Fill each labeled bottle with filtered river water to overflowing from bucket provided.
- a) Plant Groups: Place three 10 cm. segments of SAV plants in bottles. b) “Control” Group: Fill bottles with water. Do NOT add plant to bottle.
- Place a stir bar into each bottle.
- Place bottle on stir plate and set stirring speed so that the water is significantly stirred.
- Immediately have the instructor measure the initial oxygen concentration of all bottles using the oxygen meter.
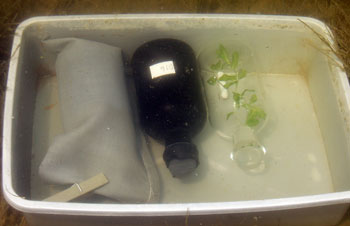
- Tightly cap your bottles and place in a water bath for at least 1 hour (note the time).
- For shaded bottle (B), add shade cover before placing bottle in water bath.
- Record your oxygen readings (mg/l) under the Initial O2 column on the data sheet.

Part B. Determining the Final oxygen concentration
- After an incubation period of at least one hour, retrieve your bottles from the water bath and note the time.
- Have the instructor measure the oxygen concentration in each of the bottles.
- Record the oxygen readings (mg/l) in the Final O2 column of the data sheet.
Results: Data Analysis
Part C. Determining Photosynthesis in relation to light level
- Calculate the change in oxygen as by subtracting the Initial O2 from the Final O2.
- Obtain data from the control group and record readings from the “blank” bottles on your data sheet.
- Use the data from the control bottles to correct your readings by subtracting the change in oxygen in the blank bottles from the corresponding readings in all three experimental bottles.
- Each group is considered a replicate. On your data sheet, average the data from all three groups for each light level to determine the average oxygen change.
- Graph your results to show the relationship between light and photosynthesis as measured by the change in oxygen.
References
- Website of University of Maryland scientist, Dr. Laura Murray, http://hpl.umces.edu/faculty/murray/index.html
National Science Education Standards
9-12 A. Science as Inquiry
- Abilities necessary to do scientific inquiry
- Understandings about scientific inquiry
9-12 C. Life Science
- Matter, energy, and organization in living systems
- The behavior of organisms
9-12 F. Science in Personal and Social Perspectives
- Environmental quality
- Natural Resources
