 Introduction

Sea Level is the sea height relative to a benchmark on land. Sea level rise is an increase in sea height over a period of time such that fluctuations due to tides and waves are factored over time, e.g. months to years. Over the past decades, increases in sea surface height have been attributed to increases in temperature of the ocean due to global warming. As water is heated it expands, resulting in inundation of coastal areas. Additionally the melting of the ice caps contributes to the rise in sea height.
Storm Surge is the rise in sea height due to the “pushing” up of water onto land by winds contained in storms, such as hurricanes. Factors determining the height of the storm surge include the strength of the wind in the storm, speed of storm, and slope of the sea floor leading to the shore, and stage of tide (high or low). For more information, visit the Hurricane Preparedness website's storm surge page.
Objectives
To explain what areas of the coast line will be flooded in a given number of years; to predict flooding from storm surges.
Materials
- Graphs and charts of calculated and actual estimates of sea level rise
- Laminated topographic maps of local areas 1:24000 scale with 5 ft contour lines (available at your county Natural Resources Conservation Service office or USGS)
- Non-permanent marking pens
- Student Worksheet, (optional, download below)
Procedure
Part 1. Becoming familiar with topographic maps
1. Locate the following on your topographic map and note the color:
| Land Type | Map Color |
| Water | __________________ |
| Forest | __________________ |
| Towns | __________________ |
| Agriculture | __________________ |
| Contour Lines | __________________ |
| Major Highway | __________________ |
| Secondary Road | __________________ |
| Buildings | __________________ |
2. Using the non-permanent markers, trace the shoreline of the area, circle major buildings such as schools, churches, and mark several main roads.
Part 2. Determining flooded areas from sea level rise
1. Using the information provided in the table below, determine the current rate of sea level rise in mm per year.
- Observed total sea level rise (1993-2003)_______mm/year.
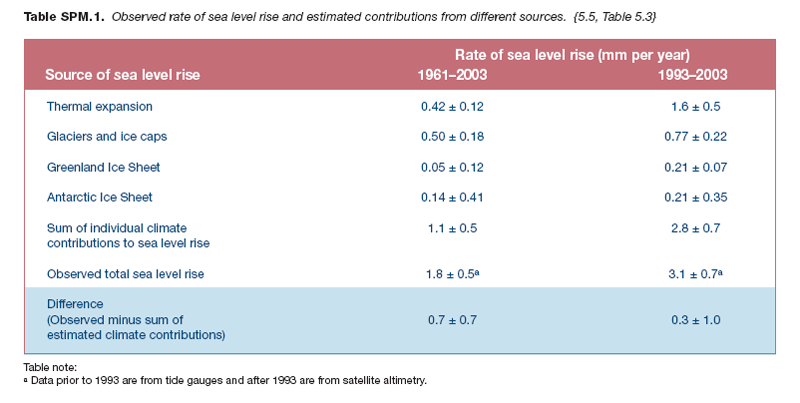
Rate of sea level rise, from various sources and sources combined. Source: IPCC, 2007
2. Determine how many years it will take to flood the areas listed below.
| Area | Years to Flooding |
| School | ________________ |
| Hospital | ________________ |
| Major Highway | ________________ |
| Secondary Road | ________________ |
| Neighborhood | ________________ |
3. Using the graph below, determine how many meters the sea level will have risen by the year 2100 under a best case scenario (bottom of purple area) and worst case scenario (top of purple area).
- _______m best case
- _______m worst case
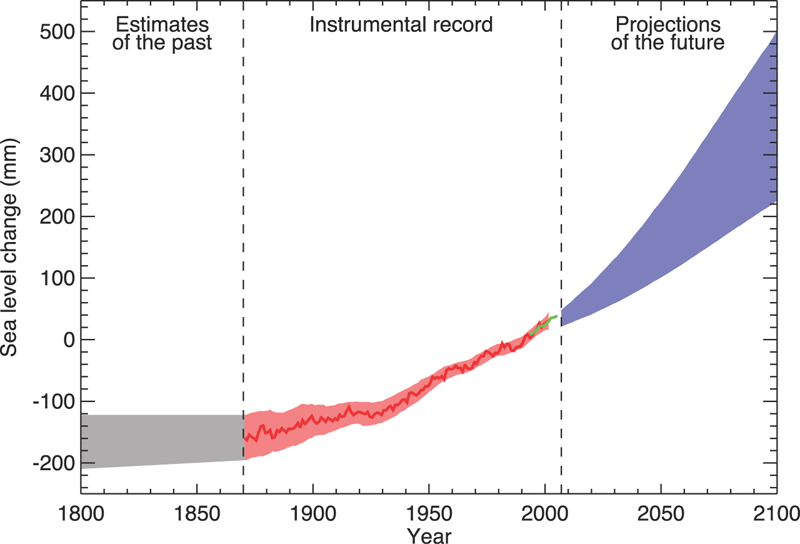
Past estimates, current records, and future projections of sea level rise. Source: IPCC, 2007
4. Use the contour lines on your topographic map to draw in the new coastline after 100 years of sea level rise.
Part 3. Determining flooded areas from a storm surge
1. Choose any coastal area from the US East Coast. Use one of the following websites to determine when high and low tide occur today in your area.
- Local, Chesapeake Bay: NOAA Tides Online
- National Data Buoy Center (click on “view details;” click on the water level plot; not all buoys report water level, so keep looking until you find one that does)
High Tide:_________
Low Tide:_________
2. A hurricane in your area produced a storm surge of 6 feet. Would the impact of the storm be greater or less if it hits land at 8:00 AM vs. 2:00 PM today?
Map Ordering Details
Maps can be ordered from the United States Geological Survey (USGS) map store. Be sure your maps are topographic maps with contours and get the educator discount, which is quite significant!