Objective
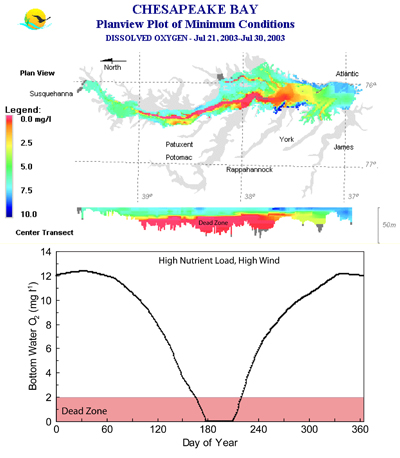
Students will explore scenarios in real datasets to investigate how physics and biology interact to produce Dead Zones of various sizes and durations. Further questioning will challenge students to apply their new knowledge of Dead Zones to real life questions.
Materials
- Dead Zone scenario cards (download below)
- Student Worksheet (download below)
Procedure
- Download data cards, which include graphs and maps of the Chesapeake Bay under the following scenarios: high wind, low nutrients; high wind, high nutrients; low wind, low nutrients; low wind, high nutrients.
- Using the data cards, students answer the questions in the student worksheet to determine the effects of wind and nutrients on the dead zone.
Lesson Resources
National Science Education Standards
K-12: Unifying Concepts and Processes
- Evidence, models, and explanation
- Constancy, change, and measurement
- Abilities necessary to do scientific inquiry
- Understandings about scientific inquiry
