Global climate change and its effects on dead zones
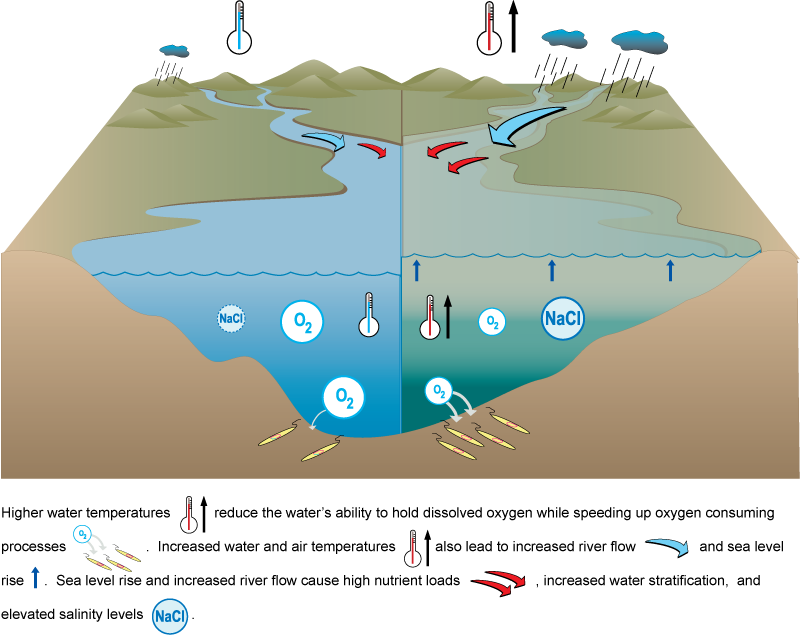 Researches are exploring how future changes in climate may affect the size and duration of dead zones. By using computer simulation models and known relationships between climatic variables (temperature, rainfall, etc.) and dead zones, scientists can make estimates of dead zone size and duration under different climatic patterns. For example, climate predictions for the Chesapeake Bay regions suggest that both air temperature and rainfall will increase in the future. These changes will cause warmer water temperatures and higher flow in the Susquehanna River. As temperatures are already increasing in the Chesapeake Bay, it is likely that these climatic changes will continue. Past research has shown that dead zones are biggest in years of high river flow (see “Learn About Hypoxia”), and that warmer temperatures reduce the amount of oxygen the water can hold and also increase the rates of oxygen consumption by bacteria and algae. The combined effects of increased temperature and river flow will likely cause larger dead zones in the future, even if nutrient loads decrease. Scientists don’t know the details of these scenarios, but ongoing research will help “clear the waters” and increase understanding of dead zones.
Building models using past data to predict dead zones
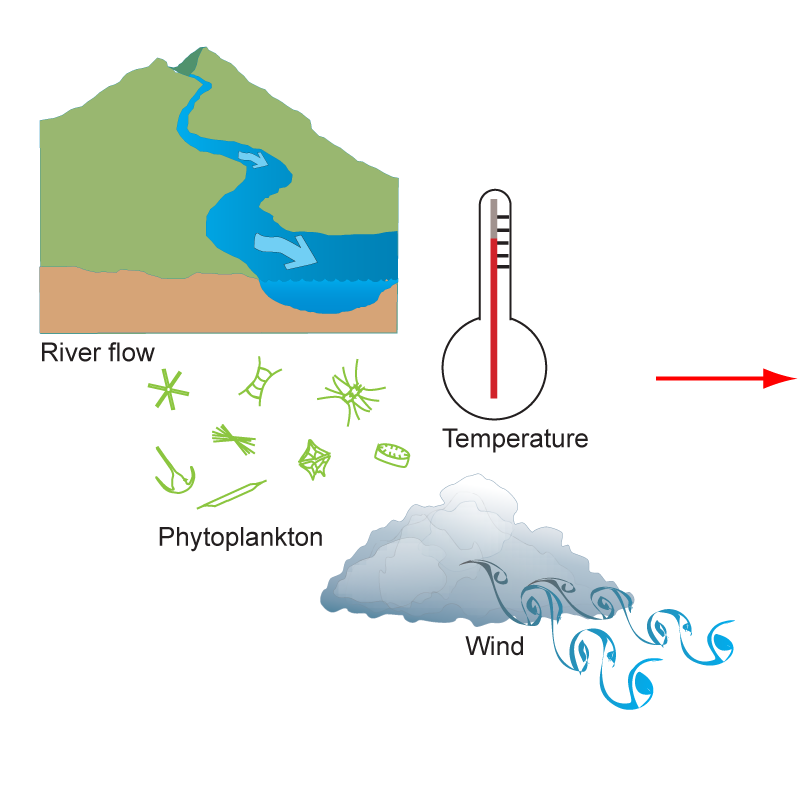
One aspect of current dead zone research is to build computer models that can accurately predict the location, size, and intensity of dead zones in the Chesapeake Bay at multiple time scales. Scientists wish to be able to predict dead zones for two reasons: (1) Learning how to predict dead zones will help researchers understand the details of what causes dead zones, which will eventually help researchers reduce dead zone size, and (2) Dead zone predictions can be used by fishermen and other water users to choose which waters to avoid. In order to predict dead zones, computer models will need to include the processes that are important in controlling dead zone size. For example, some of the major drivers of dead zone size and intensity are river flow (and also the nutrients the flow carries), temperature (which reduces the oxygen-holding ability of the water and speeds up oxygen-consuming processes), wind speed and direction (which mix oxygen from the atmosphere into deep waters) and phytoplankton biomass (which is the source of food for oxygen-consuming processes that create and maintain dead zones).
New Challenges in Dead Zone Research
Researchers want to know why dead zones in the Chesapeake Bay, the Gulf of Mexico, and some other systems are increasing when nutrient loads to these areas are stable or declining. Why are dead zones in these places still large? Several hypotheses have been proposed to answer this question, and research to test these hypotheses is underway.
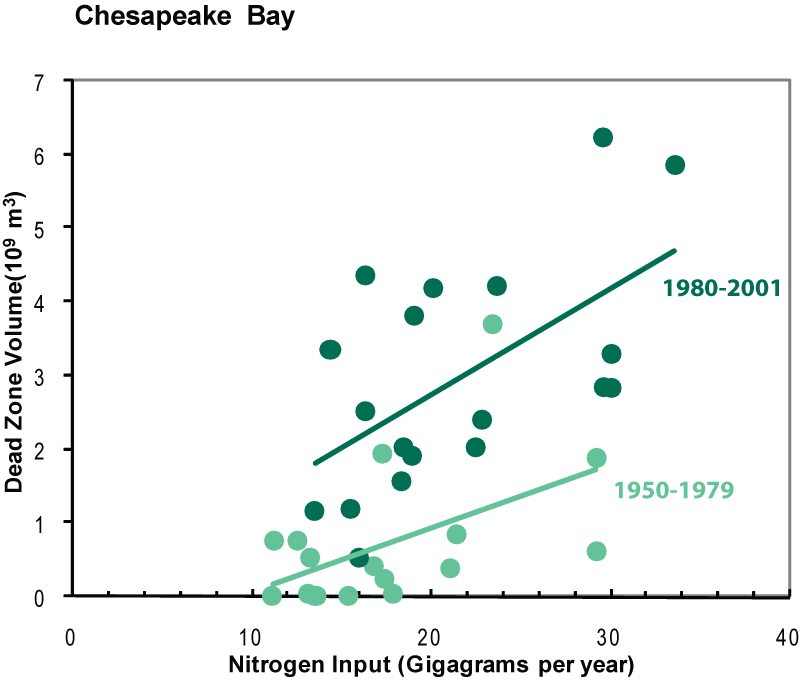
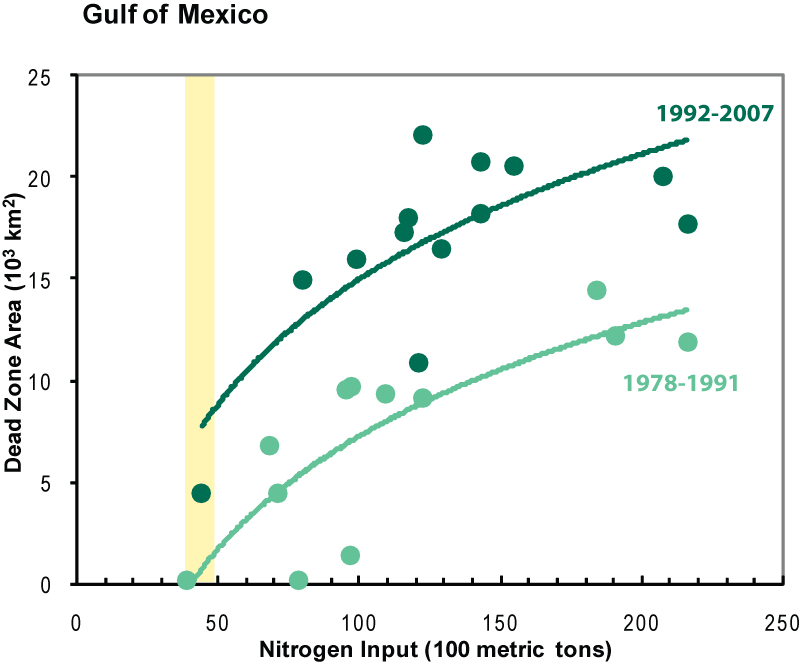
Although nutrient loads in recent years (dark green) to the Chesapeake Bay and the Gulf of Mexico are equivalent to those of earlier years (light green), dead zones have continued to grow. For example, in 1978 (highlighted), the nutrient input to the Gulf of Mexico was about 4000 metric tons, and the Fulg's dead zone was nearly nonexistent. In 1992, however, the same nutrient lad led to at dead zone covering about 5,000 square kilometers. Chesapeake Bay figure created with data from J.D. Hagy et al. 2004 (Estuaries 27); Gulf of Mexico figure created with data from Turner et al. 2008 (Environemtnal Science and Technology) (in press).
 One hypothesis is that the continued existence of dead zones has reduced the abundance and diversity of animals that live in sediments. Because these animals burrow into the sediment and allow oxygenated water to move deeper in the sediment, a film of oxygenated sediment often occurs when animals are abundant. This oxygenated layer serves as a lid to keep the nutrient phosphorus in the sediment and supports a process to remove the nutrient nitrogen from sediment. When the animals are gone after a prolonged dead zone, this oxygenated layer disappears or shrinks, allowing more nitrogen and phosphorus to leave the sediment and serve as food for algae, which later die and are consumed by bacteria. This process requires more oxygen and causes the existing dead zone to expand.
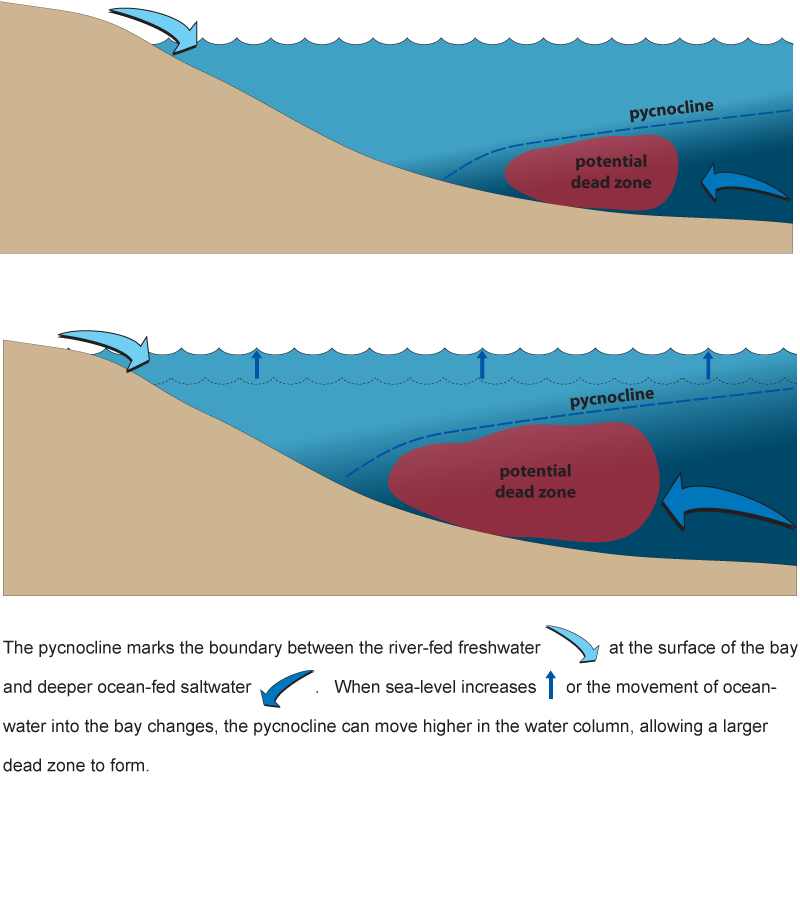 Another hypothesis for the Chesapeake Bay is that the way the water moves has changed. A layer called the pycnocline is located between the more fresh, river-fed surface waters and the deeper, ocean-fed waters of the bay. If increased sea levels or changes in the movement of water into the Bay from the ocean have occurred, the pycnocline, which often controls the height of the dead zone, may have moved upward in the water column, allowing dead zones to occur in shallower water and increasing the overall volume of hypoxic water.
Many other hypotheses are being tested, and in time, scientists hope to understand the processes well enough to suggest how to minimize dead zones.
Two research efforts in the Chesapeake Bay area are looking into these questions-- find out what they are doing at the following links: